How we made GitHub Actions cache up to 6× faster


During my first months at Avrea, engineering cache infrastructure has been by far my favorite challenge to work on. The work started with actions/cache, which powers much of the actions ecosystem. All of the setup-* actions call it under the hood: setup-node, setup-python, setup-go, setup-java, setup-dotnet. So does Docker Buildx's type=gha backend.
Making actions/cache fast makes the rest of the ecosystem fast. And on GitHub-hosted runners, it's slow.
Why the default is slow
The interface of actions/cache is good. The amount and versatility of tools built on top of it are a testament to it. We were only looking to make it faster.
GitHub stores cache entries in Azure Blob Storage. Your GitHub workflows most likely also run on Azure, but the latency between these two is not great.
The protocol used adds to the latency. The v2 GHA cache API uses Twirp, and a download is two phases: first you call GetCacheEntryDownloadURL, get back a signed URL, then you do the actual GET. That’s an extra round-trip before bytes flow. Now you have a floor on cache speed that’s “RTT to wherever the cache lives, twice, plus the time the transfer takes.”
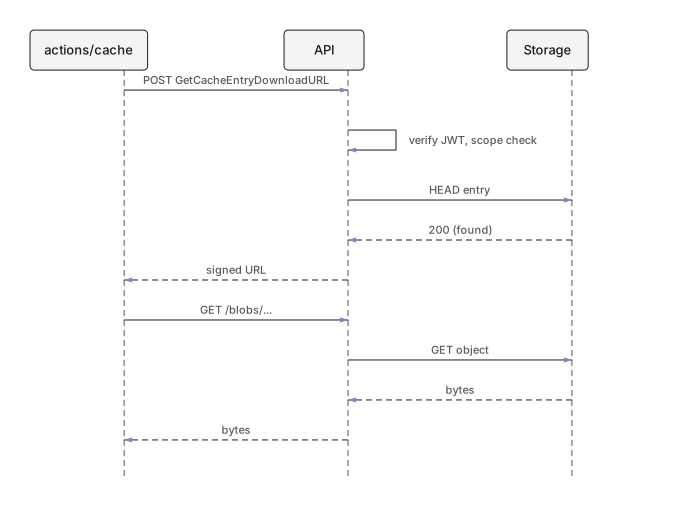
We can't collapse the two phases as the logic is baked into the client. But putting the API layer on the same host and co-locating the storage layer mitigates the problem. The harder thing is getting the runner to actually use our cache instead of Azure.
Why making the cache fast is hard
It’s relatively easy to build a fast cache in isolation. But that’s not the problem we are solving here. The actual problem is closer to “build a drop-in replacement for an existing cache, with all of its constraints, that also happens to be fast.”
There are six things you don’t get to change:
(Most of) the environment. GitHub Actions Runner Images execute GitHub workflows. What’s installed on the machine and how you interact with it is fixed. We could ask the user to make changes to their workflow yaml, but we’d rather change the runtime than the workflow. Luckily we can choose the machines that run the runners. And we chose fast machines.
The client. actions/cache is JavaScript running inside Node inside the user’s runner. That’s code outside of our control and that would be hard to change without breaking backwards compatibility or requiring the user to adopt another action. So every optimization has to live outside of the environment and the client code.
The protocol. The client speaks a specific set of Twirp calls and uses a specific subset of Azure Blob HTTP semantics.
The security model. GitHub Actions cache has access rules: branch-scoped reads, default-branch fallback, base-ref access for PRs. It’s difficult to secure GitHub Actions in general. At the bare minimum we must enforce the same scoping rules and security boundaries GitHub does itself.
The VMs are ephemeral. Every job runs in a fresh VM that is killed when the job ends. So nothing, including caches, can persist on the machine itself. Some form of attached storage, like sticky disks, is one solution but that comes with other tradeoffs. GitHub’s choice, and ours, is a network call to a cache service.
Scale. The storage layer must sustain high concurrent request volume and hold cache entries for all of our customers.
Making the cache go fast means making the cache go fast within these constraints.
A local proxy that speaks the cache protocol
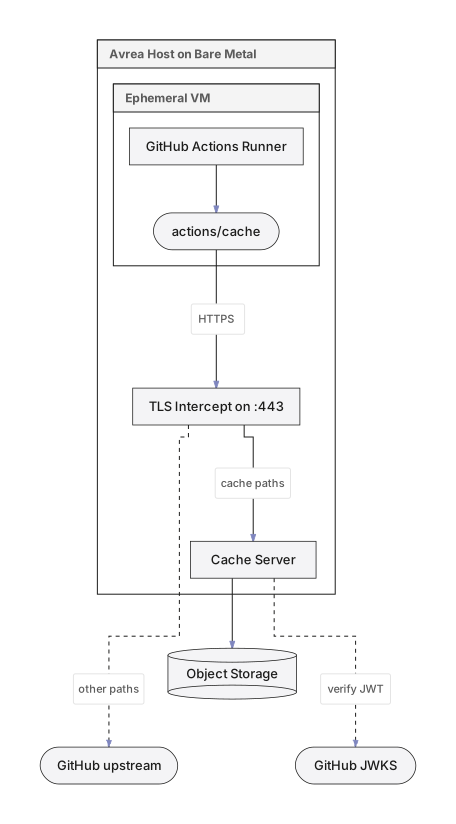
Our hosts ship with a small Go program that listens on :443 and speaks the same TLS endpoint the GitHub cache client expects to find. The runner image trusts a CA we provision and the proxy presents a cert signed by that CA.
The proxy splits traffic two ways. Cache paths (/twirp/github.actions.results.api.v1.CacheService/* and /blobs/*) it handles locally. Everything else it forwards untouched to GitHub.
The locally-handled side implements a GitHub-compatible API surface. It’s only four endpoints (CreateCacheEntry, FinalizeCacheEntryUpload, GetCacheEntryDownloadURL, plus PUT/GET /blobs/...). The blob endpoints speak Azure’s block blob upload semantics for the subset the actions/cache client requires.
Every request carries the workflow’s ACTIONS_RUNTIME_TOKEN, a JWT signed by GitHub. We verify the signature against GitHub’s JWKS and use two claims to scope the request: repository_id and ac, a JSON-encoded list of {ref, permission} entries. The ac claim controls which refs the workflow can read and write. Skip any of this and you’ve built a cross-branch cache poisoning hole or worse, something that can access entries cross-repo.
What it actually saves you

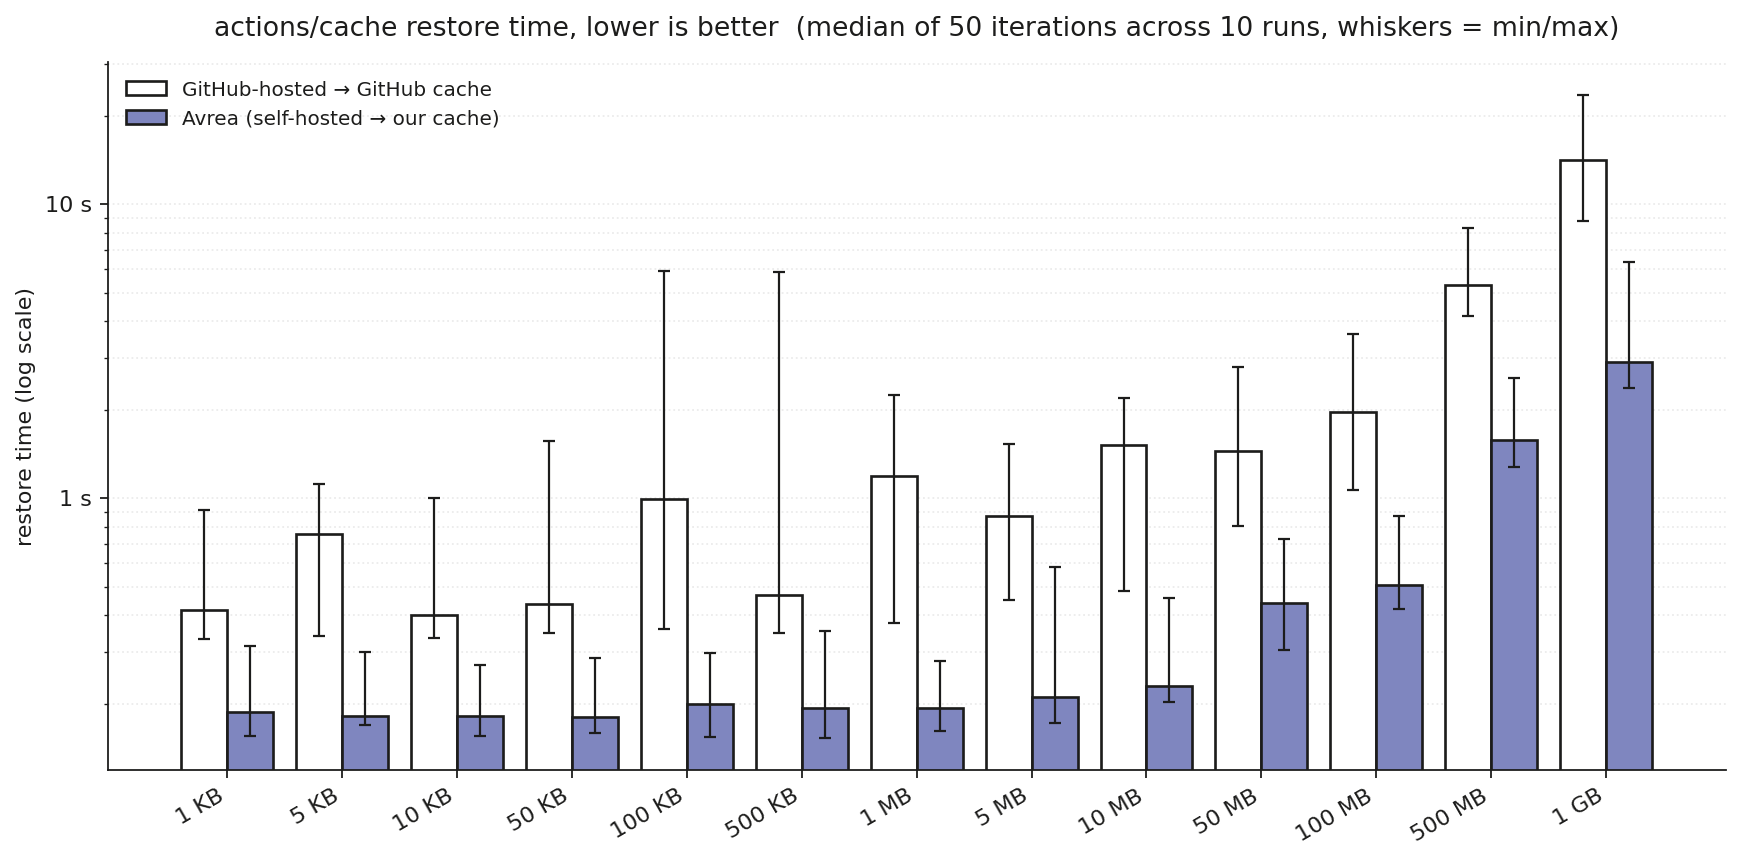
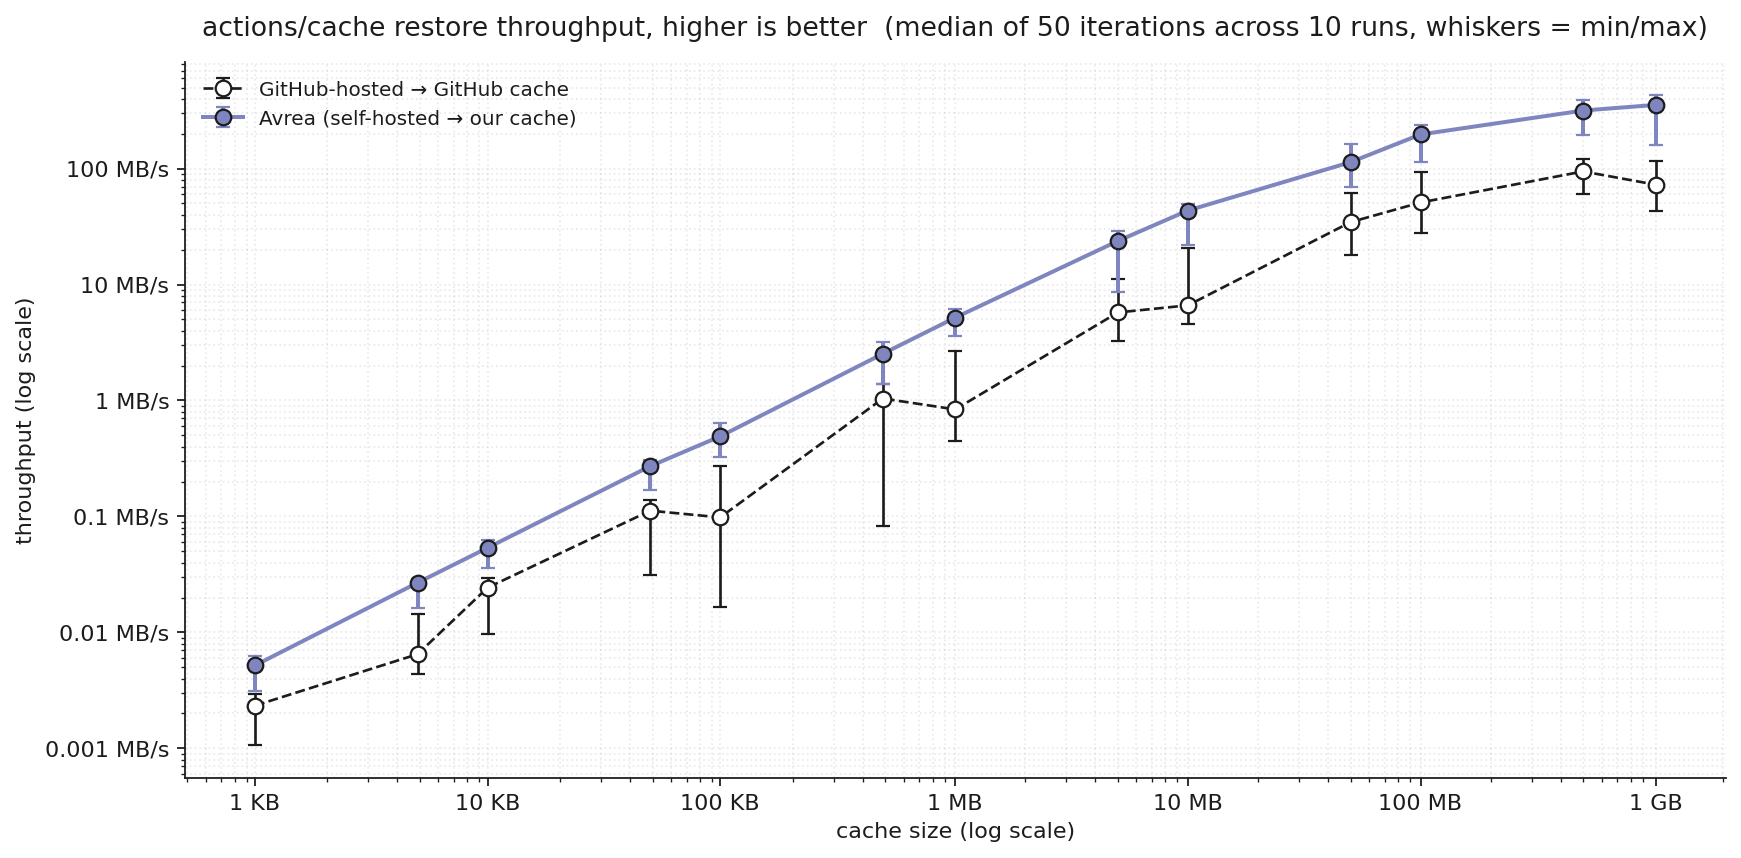
These are end-to-end step durations: the measurement starts when actions/cache/restore begins and stops when the step exits. It includes transfer, decompression, file IO, and everything the action does in between. Not the peak MB/s download speed.
Small caches, small wins. Per-request overhead dominates when the payload is small, and there’s lots of variance in GH’s small-cache latency. Bigger entries are where Avrea really shines, and not just on speed: GitHub-hosted restores show a 4-6× spread between fastest and slowest iteration at the same size; Avrea typically stays within 1.5-2×.
The min/max spread across iterations tells the variance story even more clearly:
When you run on Avrea runners, you get these speedups out of the box in all your workflows that use actions/cache or any of the many other actions built on top of it, like setup-node. For workflow examples, cache keys, and troubleshooting, see our guide to GitHub Actions caching.
How we measured it
Measuring was harder than I initially thought. Both our system and GitHub behave differently at different cache sizes and both systems experience variance, although at different levels. And because latency dominates smaller cache sizes it’s sometimes harder to spot real gains. The “Avrea is N× faster” shape only started to show once we pooled enough runs.
We measure step duration, not transfer rate. The numbers in the charts are the time the CI step actually takes, not the peak speed of bytes over the wire. Any cache restore has decompression and file-write overhead, and that overhead is a bigger fraction of total time when transfer is fast. Faster CPU and disk help here. The Node-based actions/cache also caps how fast bytes can be processed.
Every number above is the median of 50 actions/cache/restore step durations. We ran 5 iterations across 10 workflow runs of a sweep workflow that generates a random file of the target size, saves it to the cache, and then restores it on a fresh runner. Here’s the minimal form, for the 100 MB tier:
name: cache-bench
on: workflow_dispatch

jobs:
  populate:
    runs-on: avrea-ubuntu-latest
    steps:
      - name: Generate 100 MB
        run: dd if=/dev/urandom of=test.bin bs=1M count=100
      - name: Save to cache
        uses: actions/cache/save@v5
        with:
          path: test.bin
          key: bench-${{ github.run_id }}

  measure:
    needs: populate
    runs-on: avrea-ubuntu-latest
    steps:
      - name: Restore from cache  # this step's duration is the benchmark
        uses: actions/cache/restore@v5
        with:
          path: test.bin
          key: bench-${{ github.run_id }}
For the GitHub-hosted baseline, the same workflow runs on runs-on: ubuntu-latest instead.
What’s next
Our cache is fast now. But as with any type of optimization work, it is never done. Fixing one thing just moves the bottleneck somewhere else.
We have ideas on how to squeeze even more speed out of the constrained environment that requires maintaining actions/cache compatibility. But even if we manage to make it faster, the reality is that while actions/cache is very useful in a multitude of caching situations, it is less than ideal for cases where you need to cache many small entries, like when you compile code. But that’s a topic for a follow up post!
Sign up and change your workflows to runs-on: avrea-ubuntu-latest to enjoy the benefits of optimizations we’ve made. And if optimization problems excite you, please be in touch. We’re hiring.