GitHub Actions observability: understanding why your CI is slow

When a GitHub Actions workflow slows down or fails intermittently, you need to work out what changed. Step timings and logs can help narrow the investigation, but they may leave questions unanswered: was the job waiting for a runner, downloading dependencies, or running out of memory?

GitHub Actions observability means using workflow timings, logs, test results, and runner metrics to explain slow or failed runs.
For a long test step, individual test results show which cases took time and whether any retried. CPU and memory measurements from the same interval help you check for resource pressure.
What GitHub already shows you
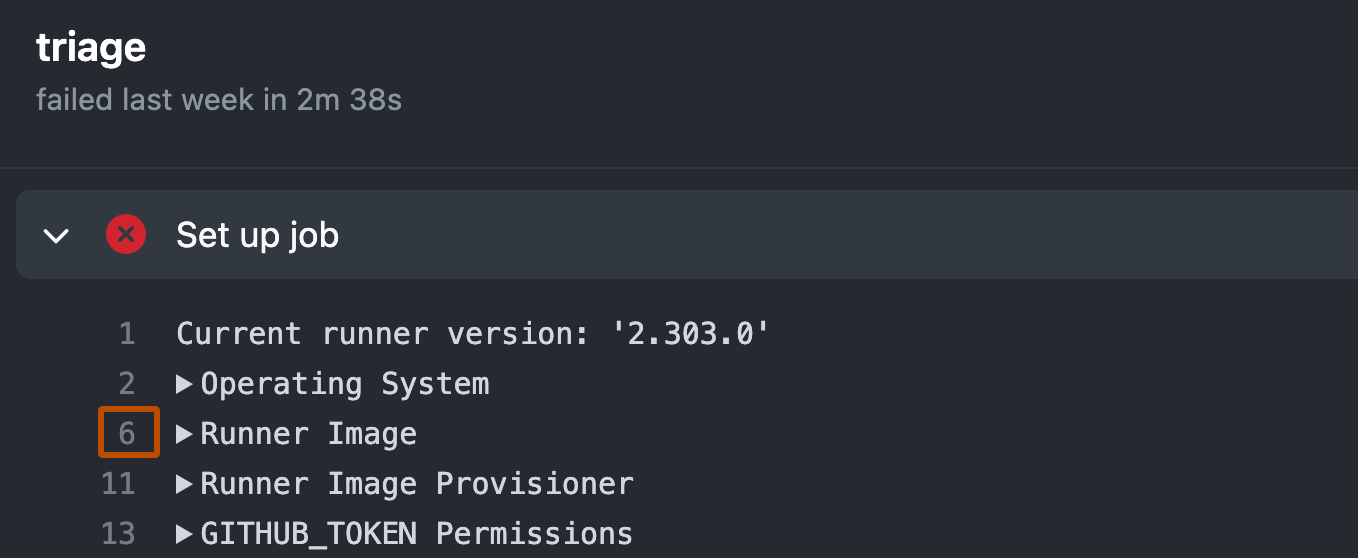
The workflow run page shows job outcomes and individual step durations. GitHub Actions logs let you inspect command output, search for errors, and download records for further analysis. On GitHub-hosted runners, the setup log also identifies the runner image and links to its installed software. This helps when a workflow behaves differently without a corresponding YAML change.
GitHub also provides aggregate usage and performance metrics, including average run times, queue times, and failure rates. These views can help identify workflows that consume substantial execution time or fail frequently. Access depends on the relevant repository or organization permissions.
Some failures are clear from the logs. Others show the immediate error but leave you investigating what caused it. A missing file, for example, could result from an incorrect path or an earlier artifact download failure.
The gaps become more apparent when a step takes longer without producing an error. Dependency installation might involve network delays, cache misses, archive extraction, or compilation during an install script. A long test step could reflect more tests, uneven shards, resource contention, or retries inside the test runner.
Find out where the time went
When someone reports that “CI is slow,” first establish what they measured.
The wait between pushing a change and receiving required checks includes execution and any time spent waiting for upstream jobs, approvals, concurrency controls, or an available runner.
Queue time and job run time need separate treatment. If a job starts late but executes at its usual speed, investigate scheduling and capacity before changing its build commands.
GitHub’s job queue-time metrics provide a baseline. If you calculate your own measurements, define which waiting periods you want to include before choosing the events and timestamps to collect. Subtracting workflow creation time from a downstream job’s start time includes the wait for upstream jobs; it does not isolate runner availability.
For a completed job, execution duration is the difference between its started_at and completed_at timestamps. GitHub exposes these fields, along with step timings and runner metadata, through the workflow jobs API.
A useful baseline consists of several runs with the same runner class, matrix configuration, and similar workload. Job names alone are unreliable: two jobs can share a name while running different operating systems or test suites.
Look for the step whose duration changed. Include setup and cleanup: checkout, cache transfer, container startup, and artifact upload can all contribute to the delay.
Line up recorded CPU, memory, disk, and network measurements with the slow step’s timestamps. If no measurements were retained, reproduce the problem with monitoring enabled. On self-hosted runners, save host or container measurements alongside the runner identity and job timestamps. For managed runners, check the provider’s per-job history.
Avrea’s job metrics include CPU, memory, network, filesystem, and disk I/O measurements. When cache extraction or a build step slows down, compare its timestamps with these measurements to investigate which resources were busy.
Sustained CPU usage warrants examining what the process is computing and whether it can use additional cores. Low aggregate CPU does not rule out a single saturated core. If memory usage rises with the test worker count, rerun with fewer workers and compare peak memory, duration, and failures.
On self-hosted runners, also check competing processes and persistent workspace state. For containerized jobs, distinguish container resource limits from the host’s available capacity.
When ordinary logs are insufficient, GitHub supports additional diagnostics through ACTIONS_STEP_DEBUG and ACTIONS_RUNNER_DEBUG. Use these for a targeted reproduction when you need more detail about action or runner execution. They do not replace resource monitoring or application profiling.
With Avrea’s CLI, you can retrieve only the failed steps’ logs or watch a running job’s CPU and memory measurements:
Replace <job-id> with the job you are investigating.

A cache hit can still leave you with a slow build
Different GitHub Actions cache types save different work. Downloaded packages, installed dependencies, compiler outputs, and Docker layers each avoid different operations.
For example, the package-manager caching supported by actions/setup-node does not cache node_modules. Restoring it can avoid downloads, but the workflow still needs to install dependencies.
Read the cache restore logs alongside the requested key and any matched key. With actions/cache, cache-hit == 'true' indicates an exact match. A value other than 'true' does not necessarily mean nothing was restored; a fallback restore may still have supplied useful files.
If you expected a hit, check whether the lockfile, toolchain, architecture, or cached paths changed and how those values affect your key. Also check cache scope, eviction, and whether an earlier run successfully saved the entry. GitHub’s dependency caching reference explains the matching and access rules.
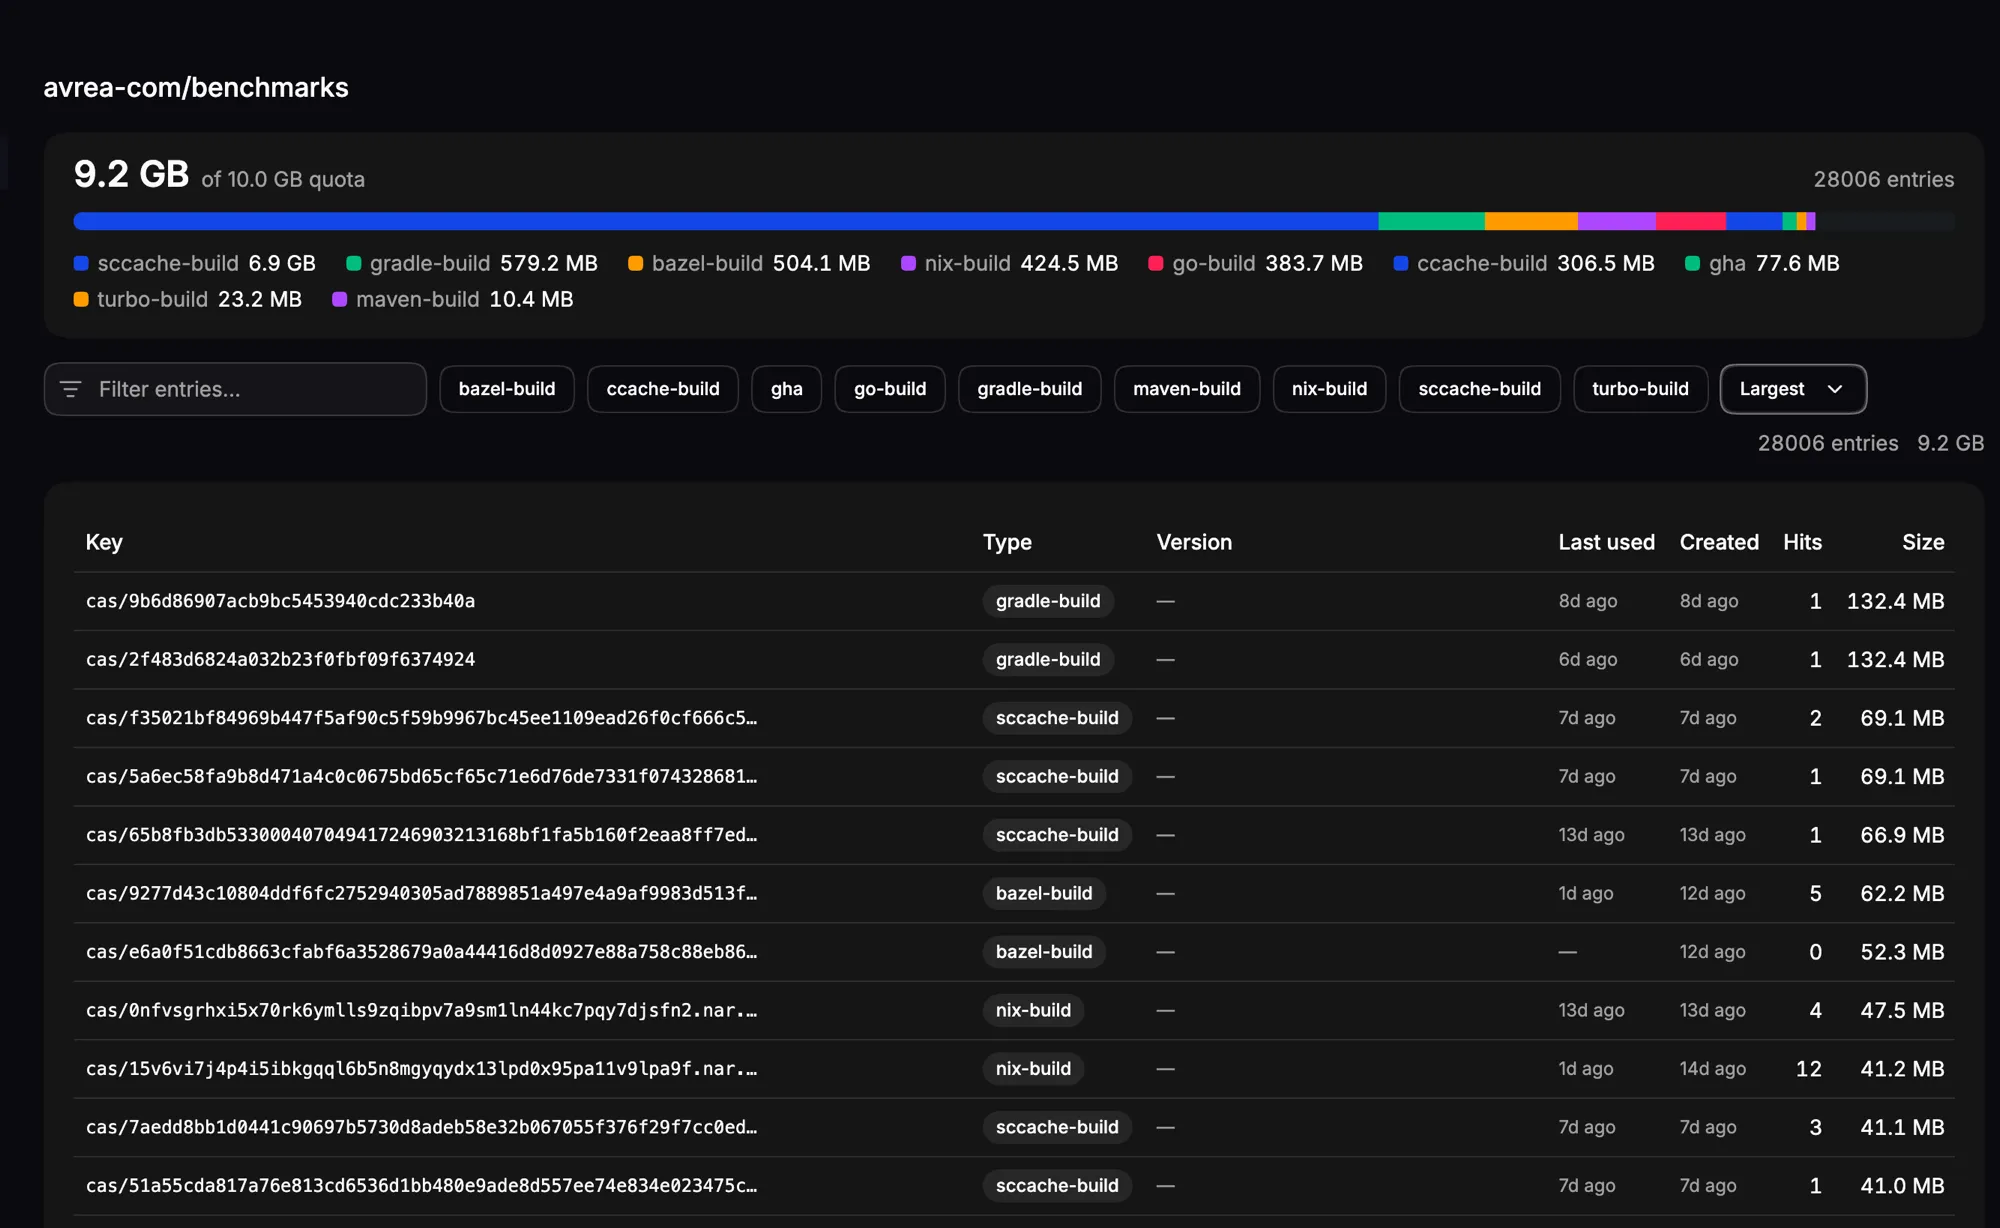
In Avrea, you can inspect cache entries by repository, including each entry’s type, key, size, hit count, and last-used time. The cache view also shows quota usage. This lets you check whether the entry you expected exists and whether it has been used recently.
Consider an illustrative case: dependency installation slows after a package update.
The workflow’s cache key includes the lockfile hash. The update produces a new key with no existing entry, so the first run misses the exact cache. That looks like a plausible explanation.
Subsequent runs restore the cache successfully but remain slow. The installation log shows a compiler running for a newly added dependency, and CPU activity coincides with that part of the step. The working hypothesis is that native compilation accounts for the additional time.
To test it, compare runs before and after the dependency update using the same runner class and a warm package cache. Measure the installation phase and confirm whether the added compilation accounts for the increase. If it does, investigate compatible prebuilt binaries, runtime versions, or safe reuse of compilation outputs.
Changing restore keys would not remove compilation that still occurs after the package download is restored.
Measure cache transfer time as well. A high hit rate provides little benefit if downloading and extracting the cache takes longer than regenerating its contents.
Keep the evidence when a test passes on retry
A successful rerun can unblock a pull request while leaving the original failure unexplained.
Before labeling a test flaky, check where the job failed. Registry outages, unavailable services, and runner failures can also disappear on a rerun.
Useful test reports retain every attempt, with the test identifier, parameters, duration, failure output, and retry outcome. The associated commit, runner image, shard, worker count, and random seed provide the details needed to reproduce the failure.
The distinction between test retries and workflow reruns matters. A test framework may retry internally and return a successful exit status. GitHub then records a green job even though a test failed on its first attempt. Playwright, for example, identifies tests that fail initially and pass on retry as flaky.
Choose one recurring failure and reproduce its recorded conditions before changing the runner or test configuration.
Does it fail only with multiple workers? Only after a particular test? Only on one architecture? Does it depend on an external service or a fixed timeout?
On a smaller runner, a test may hit its timeout because the machine is under load. Check resource usage during the failed attempt and examine what the test was waiting for before increasing the timeout or runner size.
Preserve retry outcomes while you investigate. If you quarantine a test, give it an owner and a clear condition for returning it to the blocking suite.
Collect metrics you can act on
Workflow feedback time, queue time, job and step durations, first-attempt failures, and rerun minutes cover the main questions: how long developers wait, where execution time goes, and how often work repeats. Cache outcomes and runner metrics help explain changes in those numbers.
Look at distributions as well as averages. The median describes an ordinary run; p95 shows the duration below which roughly 95% of the measured runs fall. Keep the population explicit. A duration chart containing only successful runs excludes timeouts, which may be the runs you most need to understand.
Apply the same care to failure rates. Decide how you treat cancellations, skipped jobs, and retries before comparing workflows.
Keep elapsed workflow time separate from total execution minutes. Parallel jobs consume resources simultaneously. The critical path—the sequence of dependent jobs and waits that determines completion—controls when the workflow finishes. Shortening a job outside that path may reduce compute usage without making checks arrive sooner.
Segment results by workflow, job, runner class, and meaningful matrix dimensions. Otherwise, a shift toward a larger test suite can look like a performance regression in an unchanged job.
A frequently used workflow is a manageable starting point. Establish its baseline, investigate a known delay, and compare equivalent runs after the change.
Do you need OpenTelemetry?
You can build useful GitHub Actions observability without OpenTelemetry.
Native GitHub views, API records, structured test reports, and runner measurements can answer many of these questions. OpenTelemetry becomes relevant when your organization wants CI data in an existing telemetry platform or needs consistent instrumentation across several CI systems.
Its CI/CD semantic conventions provide a shared vocabulary for pipeline and task signals. Someone also has to collect the data, match it to runs and retries, and maintain the dashboards.
That can be a sensible investment for a platform team with an established observability stack. For a team investigating a handful of troublesome workflows, start by checking whether the available logs, test reports, and runner measurements answer the immediate questions.
Where Avrea fits into the investigation
Avrea combines managed runners with CI diagnostics. Its documented observability features include organization-wide run history, step durations, searchable logs, failure rates, and p50/p95 duration trends for successful runs.
Its flake metric flags failed jobs where the same step has succeeded in other runs. Use this to find failures worth investigating. A step can also fail and later succeed because someone fixed a bug, so confirming a flaky test requires comparing individual test outcomes and execution conditions.
Some problems are easier to investigate while the environment still exists. Avrea supports SSH access to an in-progress job through the browser or CLI, letting you inspect files, processes, and installed tools. Its debugging documentation specifies that the VM is removed when the job ends, so live inspection needs to happen before then.
Try Avrea on a workflow with a recurring slowdown or failure. Use its run history, step logs, and runner measurements to test one explanation, then compare equivalent runs after the change.